Performance per Dollar of NVIDIA’s Mid-Range GPUs Visualized

Tsing

The FPS Review
Staff member
Joined
May 6, 2019
Messages
12,222
Points
113
nvidia-geforce-gtx-1060-1024x576.jpg
Image: NVIDIA


Have you ever wondered how much value you’ve truly gotten out of your mid-range GeForce cards? r/NVIDIA’s Hic-Sunt-Leones has drafted a chart that shows just how much each generation has provided in terms of performance per dollar.


nvidia-mid-range-gpu-perf-per-dollar-hic-sunt-leones.jpg
Image: Hic-Sunt-Leones


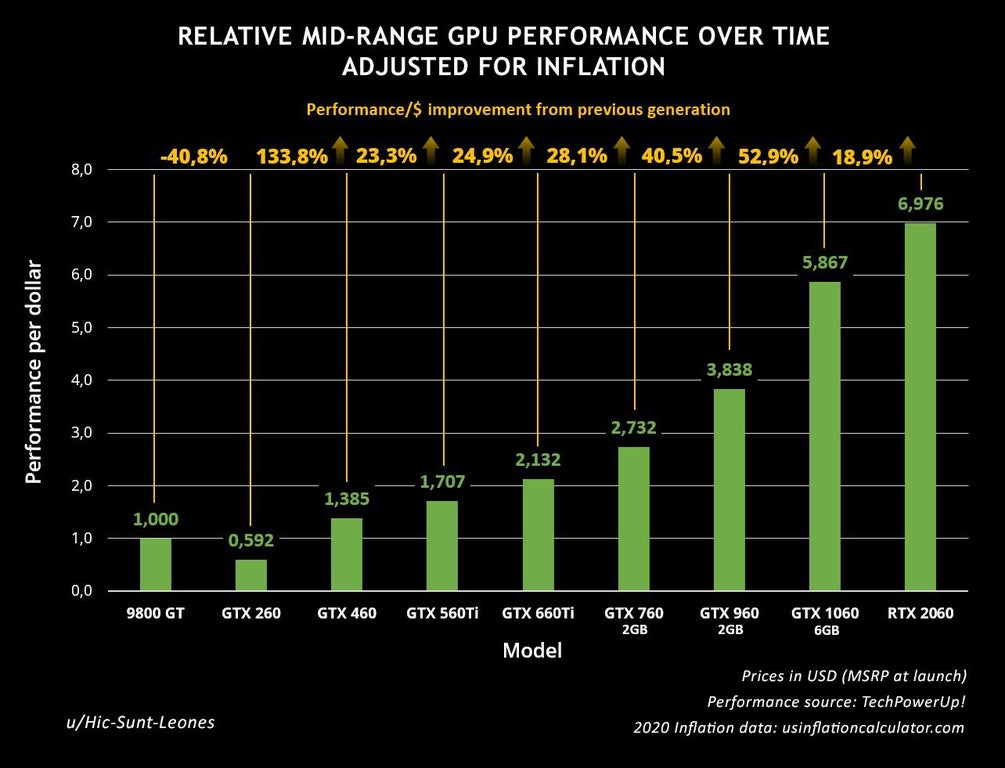
Quite clearly, the biggest winner here (of modern times, at least) is the Pascal microarchitecture, whose GTX 1060 (6 GB) provided a 53-percent improvement from the previous generation, Maxwell. The biggest loser is Turing, whose RTX 2060 provided a mere 19-percent increase over Pascal.


Plenty of GeForce GTX 1080 Ti owners have held on to that card to this day, and the numbers in...

Continue reading...
 
Hmm

Moore's Law - transistor density doubles about every 18 months

9800 GT release date July 2008 - RTX 2060 release date July 2019, so 11 years.

A $/performance factor of 7.0 across 11 years, or about 100% increase every 18 months.

Pretty much tracks. I do know Moore's law a) only really deals with transistor density and not actual performance or price, and b) is "dead", and c) there are many other factors in this graph, but this just strikes me as an odd coincidence.

Two things that would be interesting. A similar graph for top tier cards (not that they have ever been a value proposition, but it would be striking I think), and a similar chart that could show AMD's influence -- how healthy competition affects this.
 
Become a Patron!
Back
Top